The Injury League: The Eye Watering Cost of Premier League Injuries and the Most Injured Players REVEALED


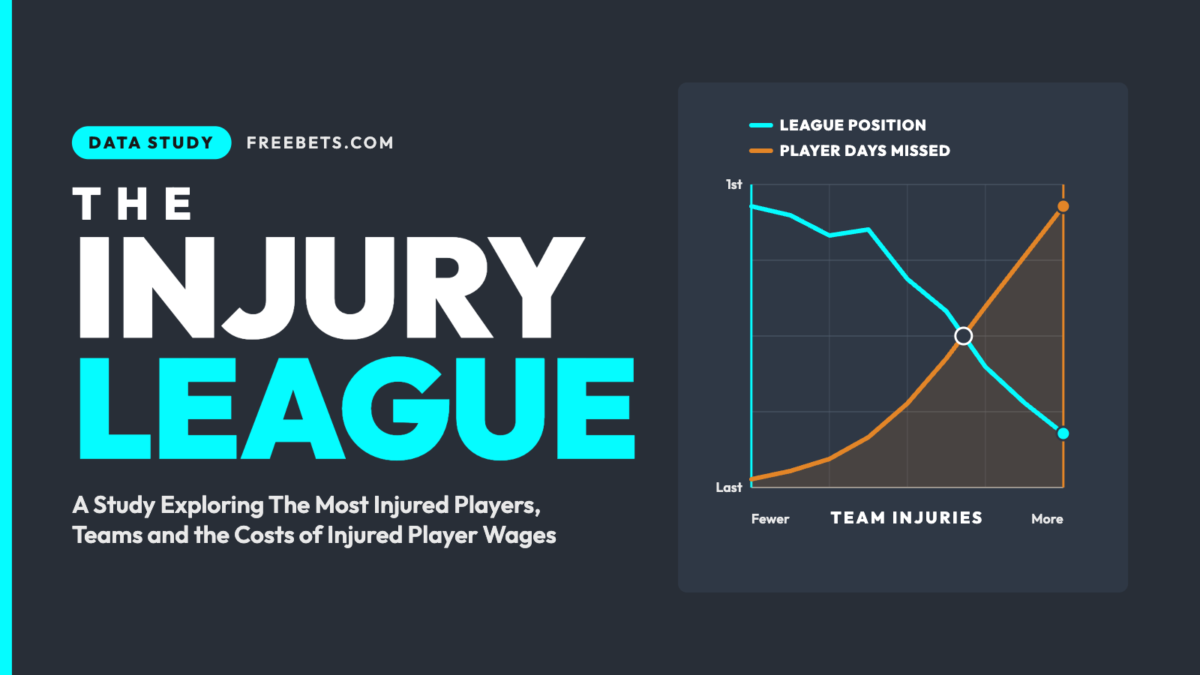
Injuries can make or break a team's season, and Premier League talent certainly isn't cheap. We've analysed the most injured teams, players and the cost of those injuries across the past three Premier League seasons.
The short of it: Players at 25 clubs lost 107,670 days to injury across three Premier League seasons, equivalent to 295 years of first-team availability. Clubs paid an estimated £913m in wages while those players were sidelined. Read on to discover the most injured teams and players, including the hefty wage bills involved.
Note on the dataset: The football data experts at Free Bets tracked 837 players from 2023/24 to 2025/26, 723 of whom were injured at least once, and matched each to season-by-season wage estimates. The result is the Injury League, an interactive leaderboard of the most injured players and teams. Sort it, filter by season, search your club and click any team to see its ten biggest casualties.
The Most Injured Players
Brentford's Josh Dasilva lost more days than anyone: 1,067 across three injuries, all logged against 2023/24. That is almost three years. Burnley's Jordan Beyer (967 days) and Sheffield United's John Fleck (923 days from a single injury) come next, then Brighton's Solly March with 802 days across eight layoffs.
| Player | Club | Days lost | Injuries | Est. wages lost |
|---|---|---|---|---|
| Josh Dasilva | Brentford | 1,067 | 3 | £4.6m |
| Jordan Beyer | Burnley | 967 | 3 | £1.6m |
| John Fleck | Sheffield United | 923 | 1 | £3.3m |
| Solly March | Brighton | 802 | 8 | £5.7m |
| Rico Henry | Brentford | 720 | 7 | £3.6m |
| Tom Lockyer | Luton Town | 662 | 1 | £1.9m |
| Cheick Doucouré | Crystal Palace | 661 | 5 | £6.6m |
| Aaron Hickey | Brentford | 643 | 5 | £6.4m |
| Roméo Lavia | Chelsea | 631 | 12 | £4.6m |
| Enes Ünal | Bournemouth | 621 | 5 | £1.4m |
Brentford have three of the ten: Dasilva, Henry and Hickey lost 2,430 days between them, more than a third of the club's total.
Count injuries instead and the order changes. West Ham's Nayef Aguerd suffered 14, the most in the dataset, though they added up to 276 days. Leeds' Noah Okafor had 13. Lavia is the only player in the top ten of both lists. Brighton's Brajan Gruda also had 12, but only 153 days in total, a run of knocks rather than long layoffs.
The Most Expensive Injuries
Wages reorder the table again. Chelsea's Wesley Fofana has the costliest injury record in the dataset: 568 days over seven injuries, worth an estimated £16.2m in wages. Arsenal's Gabriel Jesus (£13.4m), Chelsea's Reece James (£13.3m), Manchester City's Rodri (£13.1m) and John Stones (£12.1m) complete the top five. Manchester United's Luke Shaw (£11.9m), Arsenal's Kai Havertz (£11.4m), United's Mason Mount (£11.3m), City's Kevin De Bruyne (£11.1m) and Tottenham's James Maddison (£9.7m) round out the top ten.
Fofana and James alone account for £29.6m of Chelsea's bill. City have three players in the top ten (Rodri, Stones and De Bruyne), together worth £36.3m. Erling Haaland lost only 119 days, but on £525,000 a week that is still £7.4m. Dasilva, the most injured player by days, cost an estimated £4.6m, less than a third of Fofana's total.
The ten costliest players account for £123.5m, or 13.5% of the overall figure.
The Most Injured Teams
Tottenham lost the most days, 7,413 across 142 injuries, but squad size flatters them.
| Club | Days lost | Injuries | Est. wages lost | 23/24 finish | 24/25 finish | 25/26 finish |
|---|---|---|---|---|---|---|
| Tottenham | 7,413 | 142 | £85.6m | 5th | 17th | 17th |
| Brentford | 6,624 | 96 | £31.1m | 16th | 10th | 9th |
| Chelsea | 5,880 | 165 | £80.5m | 6th | 4th | 10th |
| Brighton | 5,773 | 140 | £37.5m | 11th | 8th | 8th |
| Manchester United | 5,647 | 131 | £89.4m | 8th | 15th | 3rd |
| Burnley | 5,193 | 73 | £19.7m | 19th | Championship | 19th |
| Newcastle | 5,081 | 111 | £49.9m | 7th | 5th | 12th |
| Bournemouth | 4,880 | 95 | £26.0m | 12th | 9th | 6th |
| Arsenal | 4,516 | 137 | £88.0m | 2nd | 2nd | 1st |
| Liverpool | 4,486 | 136 | £62.0m | 3rd | 1st | 5th |
Spurs have the most players in the sample (44). Adjust for that and Brentford lead on 184 days per player, ahead of Newcastle (175) and Spurs (168). Chelsea suffered the most injuries (165) but relatively short ones, at 36 days on average. Brentford and Burnley had far fewer (96 and 73), yet theirs lasted about 70 days each.
Manchester United: no club spent more on injured players
United's injured players cost an estimated £89.4m in wages, the highest bill in the dataset and £1.3m more than Arsenal. They lost 5,647 days across 131 injuries, fifth for days but first for money, because so many of the injuries fell on well-paid players.
Four players account for £41.1m, or 46% of the total: Luke Shaw (£11.9m), Mason Mount (£11.3m), Lisandro Martínez (£9.1m) and Matthijs de Ligt (£8.8m, a floor figure because some of his wage data is missing). That makes four of the 20 costliest injury records in the dataset, level with City. Harry Maguire added £7.0m across 11 injuries, and Tyrell Malacia cost £5.4m from a single injury that ran to 500 days, all logged against 2023/24.
The bill was front-loaded: 81% of United's days came in 2023/24 and 2024/25, when they finished eighth and 15th. Per day lost they sit behind City (£23,600) and Arsenal (£19,500) at roughly £15,800, so volume put them top, not extravagance.
What Injuries Did to the Table
Injuries do not decide a season alone, but they tilt it. Across the 60 club-seasons in the dataset, we've mapped out the link between days lost and points. At the extremes it shows: the 20 most-injured club-seasons averaged 50.3 points, the 20 least-injured 57.4. More than a ten percent swing.
Some notable examples:
| Club | Season | Days lost to Injury | Finish | Points |
|---|---|---|---|---|
| Liverpool | 2024/25 | 1,086 | 1st | 84 |
| Liverpool | 2025/26 | 1,833 | 5th | 60 |
| Newcastle | 2024/25 | 981 | 5th | 66 |
| Newcastle | 2025/26 | 1,451 | 12th | 49 |
| Brentford | 2023/24 | 3,295 | 16th | 39 |
| Brentford | 2025/26 | 1,176 | 9th | 53 |
| Manchester United | 2023/24 | 2,911 | 8th | 60 |
| Manchester United | 2025/26 | 1,050 | 3rd | 71 |
Brentford cut their sick days by 64% and gained 14 points. Liverpool's lowest-injury season brought the title; their highest brought a 24-point drop. In 2023/24, United and Newcastle lost 5,560 days between them and finished level on 60 points, three behind sixth-placed Chelsea.
Then come the what-ifs. Tottenham lost 2,137 days in 2023/24 and missed fourth place by two points. In 2025/26 they lost 3,094, the second-highest club-season total in the dataset, including 1,039 from Dejan Kulusevski, Xavi Simons and James Maddison, and stayed up by two points. West Ham went down on 39 points having lost 60% fewer days.
Manchester City lost Rodri for 282 days in 2024/25 and finished third, three points behind Arsenal and 13 behind Liverpool. Arsenal's own days nearly doubled that season to 2,106, with Jesus, Saka and Havertz out for 576 between them, and they finished ten points off the top. A year later, with 1,321 days lost, they were champions.
Not every bad season is an injury story though. Wolves lost 573 days in 2025/26, their fewest of the three seasons, and finished bottom on 20 points. Burnley's 22 left them 19 short of safety.
For more football insight, data and tips, subscribe to the freebets.com mailing list, where you'll also receive the latest offers from the best betting sites on the market.
About the data
Injury data comes from Transfermarkt and wage estimates from SalaryLeaks and Capology, correct as of 2 November 2026. Wages lost are each player's weekly wage multiplied by days injured divided by seven, treating every day as a full-wage day. Every club total includes at least one player with incomplete wage data, and 110 players have no wage figure, so treat totals as a floor. Days are raw Transfermarkt totals logged against the season each injury began, so one layoff can exceed 365 days. They follow the player, which is why Burnley's total includes 785 days logged against 2024/25, when the club was in the Championship. League tables: 2023/24, 2024/25 and 2025/26. Free to use with credit to freebets.com.